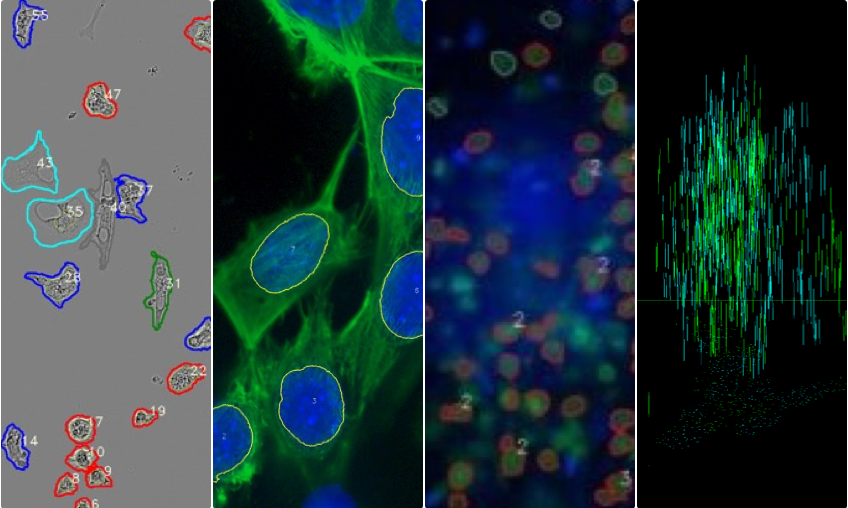
Quantification of features in cell images
The most exquisite combination of human knowledge, experience, and AI image analysis for science teams engaged in life science.
COUNTING
automatic cell counting quantification of cells in various types of biological samples.
Customization and flexibility
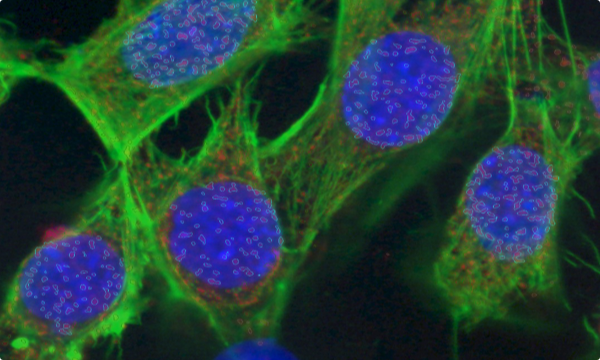
PUNCTA
The recognition and analysis of distinct point structures, within a given field of view.

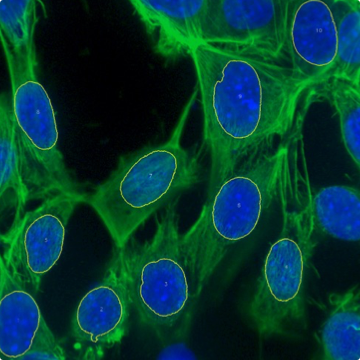
Puncta in the nucleus and in the cytoplasm
green = original NeuN image
blue = original SOX2 image (enhanced signal)
contours:
grey = NeuN cells
red = “SOX2 positive” NeuN cells
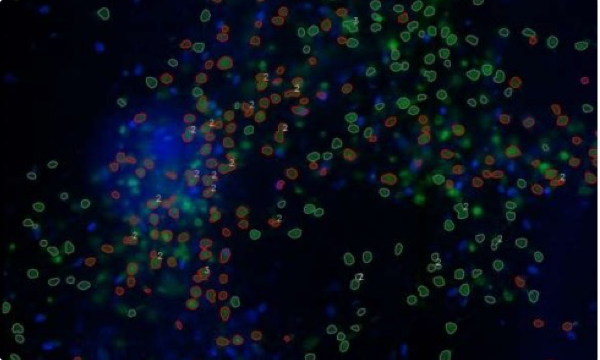
gray = puncta on green channel
blue = puncta on green channel having already signal in red channel
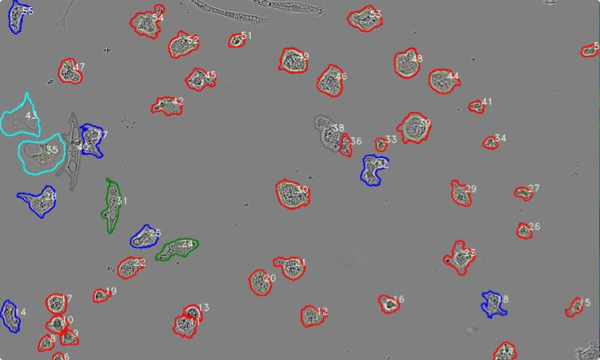
PHENOTYPING
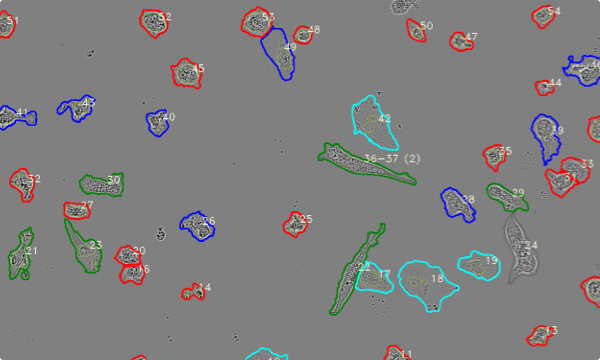
automatic determination of cell phenotype
Red = round
Grey = cluster
Blue = ameboid
Green = stick (rod)
Cyan = faint
Monocromatic images
Blue = multicore
Cyan = rod
Red = dead
Magenta = round
Yellow = amoeboid
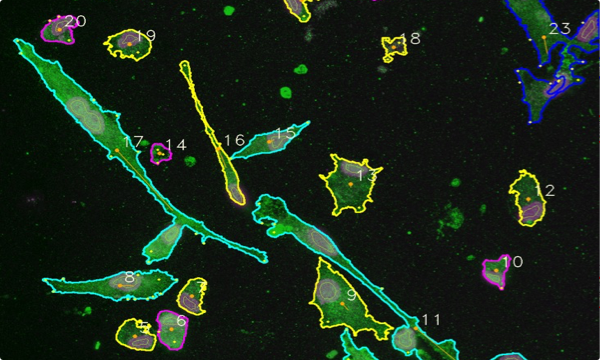
RGB images
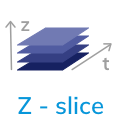
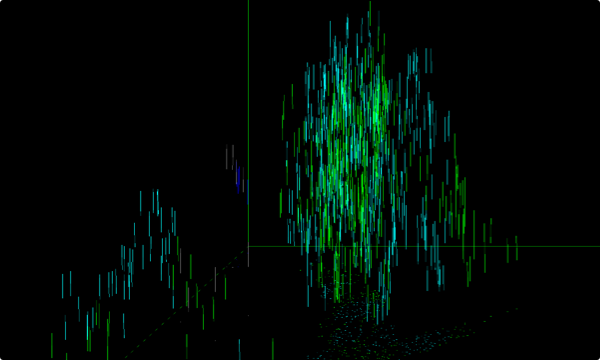
Z – SLICING
enabling the reconstruction and quantification of the entire sample volume
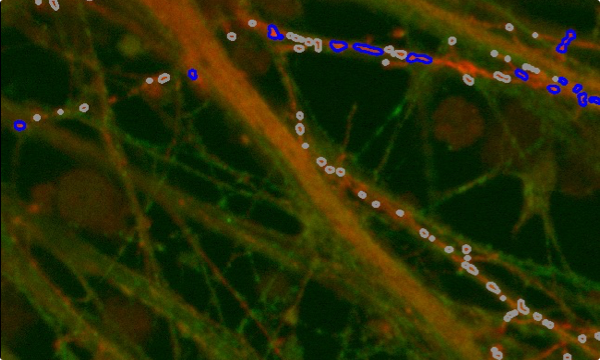
Puncta through z-slices in nucleus (blue lines) and cytoplasm (green lines)
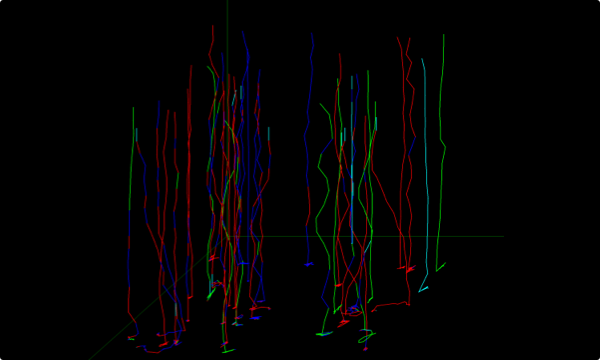
T – SLICING
reconstructs and quantifies structures over time points. It enables the analysis and visualization of dynamic changes in structures within time-lapse datasets.
How cells change their phenotypes and positions over time.

STATISTICS
data analysis
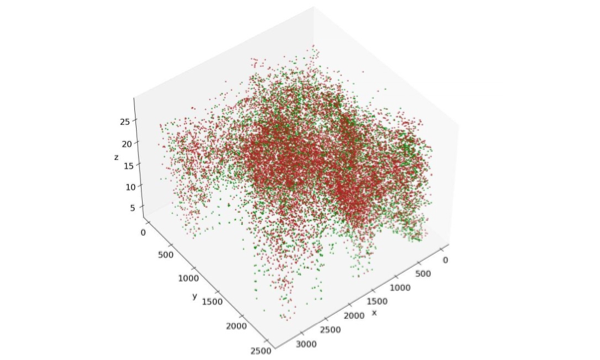
3D spatial animation of two different marker segments
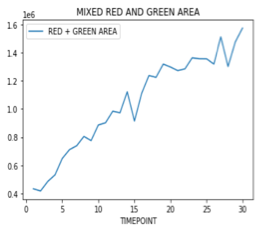
Signal measuring
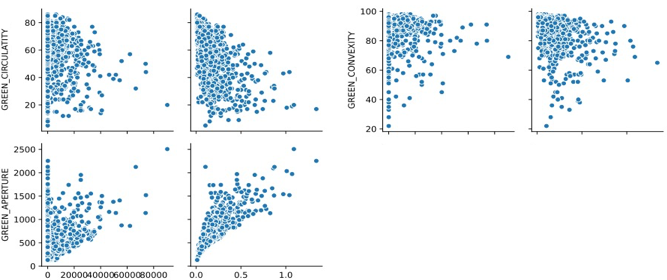
The correlation between data sets